1902 Encyclopedia > Railway, Railways (Railroad) > [Railway Statistics] Growth and Distribution of Traffic. Employés.
Railway, Railways
(Part 10)
B. RAILWAYS - STATISTICS (cont.)
[Railway Statistics] Growth and Distribution of Traffic. Employés.
Growth and Distribution of Traffic
The statistic of traffic returns of railways in the United Kingdom since 1842 indicate a remarkable steady and rapid increase of traffic. In 1842 the total receipts amounted to upwards of £4,250,000. In 1852 they were nearly £16,000.000, and during the thirty-one years following they are given at intervals as in Table XX.:—
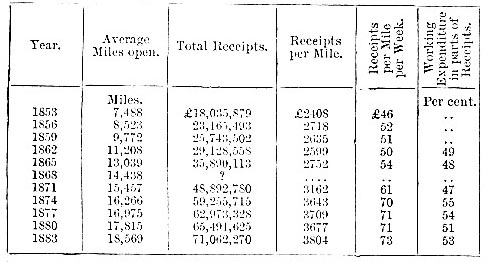
Thus the receipts were quadrupled during the thirty years from 1843 to 1883, whilst, the mileage of railway open was increased by two and a half times. The receipts per mile increased notwithstanding their continual dilution by the accession of new lines. These results, taken together, indicate the inherent elasticity of the railway and its seemingly inexhaustible resources.
Of the main trunk-lines, which constitute the foundation of the railway system, those which converge towards and terminate in London—the metropolitan lines—are more important than the provincial lines. London is the great heart of the country and is the chief centre of commerce; moreover, the metropolitan railways, taken together, possess a greater variety of traffic than others; hence they are selected for discussion illustrative of the growing magnitude and distribution of traffic. On the nine metropolitan railways, including the London and Blackwall and the North London, in operation in 1854-57, Table XXI. shows the receipts for these four years; and the receipts for the year 1883 derived from twelve metropolitan companies then in operation are added for comparison:—
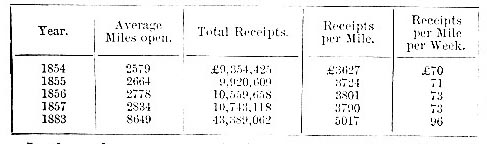
In the early years—1856, for instance—the metropolitan railway mileage open constituted one-third of the total mileage open, whilst it produced nearly one-half of the total traffic receipts of the United Kingdom, insomuch that the receipts per metropolitan mile were two-fifths more than the average total receipts per mile. Recently—in 1883—though the metropolitan mileage open was less than one-half of the total mileage open of the United Kingdom, it earned six-tenths of the total receipts; and the receipts per metropolitan mile were one-third more than the average total on the whole mileage of the country. Lastly, the increase of receipts of the metropolitan lines is greater that of the entire system. Whether, therefore, the increase of receipts be compared with the total receipts or with the mileage open, the traffic of the metropolitan railways increases the most rapidly, and it is also of the greatest absolute magnitude. But, to bring out clearly the relative importance and progress of the traffic of different districts, let us separate what may be distinguished as the coast lines to the south and east of the metropolis—the Great Eastern, and the railways south of the Thames—from the interior lines to the north and west, the Great Northern, Midland, North-Western, Great Western, and the three local lines, the North London, Metropolitan, and District. The receipts may be correspondingly classified and compared with the receipts in other parts of the United Kingdom (Table XXII.): —
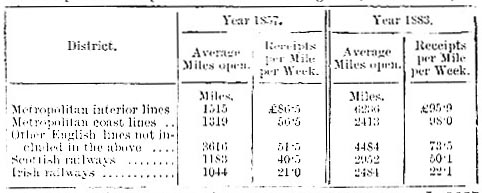
This comparative statement shows some strong contrast. In 1857 the densest traffic in England, averaging £86,10s., over 1515 miles lay to the north and west of the metropolis; the railway traffic of the country was very partially distributed; and, taking London as the great focus, the traffic radiated and converged in all directions, with decreasing intensity as the distance from the centre increased. In the year 1883, on the contrary, whilst the metropolitan traffic continued to be the densest, the traffic of the metropolitan coast lines per mile open had advanced so rapidly as even to surpass that of the interior metropolitan lines,—the receipts being £98 per mile per week against £96. The rapid development of the southern lines passenger traffic is, as will be shown, the cause of the great advance in receipts. Further insight into the comparative conditions of interior and coast lines may be got by taking four great inland lines (Great Northern, Great Western, Midland, and London and North-Western), which are lines of preponderating goods and mineral traffic, and contrasting them with four great coast lines of preponderating passenger traffic (South-Eastern; London, Brighton, and South Coast; London, Chatham, and Dover; and South-Western). In the annexed table (XXIII.) for 1883 the average fare per passenger is calculated on the assumption that the fares formed 80 per cent. of the whole receipts for passenger trains, and the average length of a passenger’s journey is got by taking 85 per cent. of the passengers as third class at 1d. a mile and 15 per cent. as first and second class at 1 3/4d. a mile.
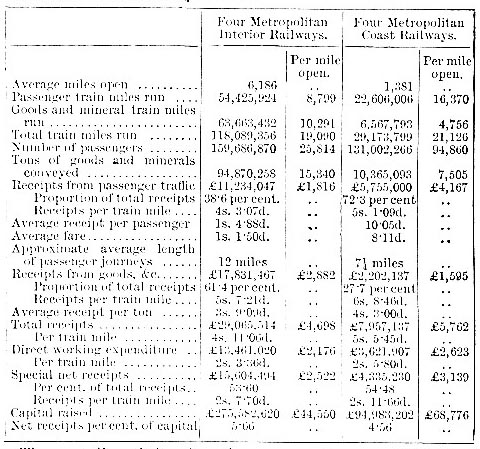
The coast lines, being freer from competition, get higher rates both of goods and passengers; but the inland lines have the advantage in direct working expenditure per train mile, and a still greater advantage in the much smaller capital raised per mile of line open, so that, in spite of competition and low rates, they earn 5 2/3 per cent. on their capital as against a little over 4 1/2 earned by the coast lines. The greater capital outlay on the coast railways seems to be due to the costliness of stations and carriage stock for a preponderating passenger traffic; and as this more than outweighs the gains from higher rates the statistic support the generally accepted opinions that goods and mineral traffic on railways is profitable and should be encouraged and developed. Mr. R. Price Williams, an accepted authority on railway statistics, supports this conclusion. Mr. F. C. Conder, on the contrary, who has deeply studied the question, maintains that the heavy mineral traffic of railways should be relegated to the canals, which, though slow, are low in their charges.
Employés
In 1856 Robert Stephenson estimated that 1 per cent. of the population of the United Kingdom was maintained by the railways then in operation, independently of the considerable amount of labor employed on railways in course of construction. On 31st March 1884 railway employés numbered in all 367,793 persons, or 19.69 per mile open, showing an increase of more than 50 per cent. on the proportion per mile in 1857, which was only 12.63. Table XXIV. gives details:—
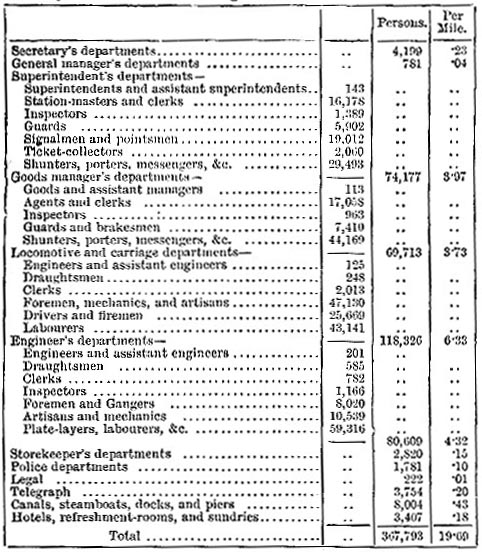
From this table it may be estimated that there are now two drivers and two firemen for every 3 miles of line open. In 1857 there were only two drivers and two firemen for every 5 miles; and, though the train service has increased faster than the train mileage, the work of the drivers has sensibly diminished, each man on an average doing 20,950 miles as against 23,420 in 1857.
Read the rest of this article:
Railway, Railways - Table of Contents
|